
Before you mark your ballot: check the letter twice
There are several measures on this November ballot, and some of them carry letters that look almost identical to one another. Read each letter carefully before you mark it — it is genuinely easy to fill in the wrong line.
This article is about Measure C — the “City Services Measure,” the hotel tax increase from 10% to 12%. Our recommendations on the other measures will follow in our voter guide before the election.
Burbank’s hotel tax has never been a fixed dollar amount. It is ten percent of the room rate — a commission the city collects on every night’s stay. The rate used to be four percent, the lowest it has ever been. Since then it has only gone up, up, and up, because commissions rise automatically when prices rise even when the city can’t manage its own budget. Mostly that is overtime and give-it-away programs like the ones on this page — every one of them is a bigger cut of your life, taken a little at a time. The rate has not changed since 1983. The money absolutely has.
Burbank’s cut of one hotel night
The pale bar is what an average night in a Burbank hotel costs. The dark block at the bottom is the city’s cut. That cut is exactly ten percent in every single bar — the rate really has not changed since 1983 — and it has more than tripled anyway, because the room above it keeps getting more expensive.
The rate has been frozen at ten percent since 1983. The money it brings in has grown more than five times over.
In the fiscal year ending 1999, the hotel tax brought in $2.5 million. In 2024 it brought in $13.2 million — 5.2 times as much — and the city projects $14.6 million next year, which is 5.8 times the 1999 figure. Not one cent of that growth required a vote.
Some of that is more hotels, and we will say so plainly: Burbank’s room count grew about 24% between 2011 and 2025. But room rates rose about 67% over the same stretch. Rate growth outran new construction roughly three to one, and the per-night chart above is unaffected by how many hotels there are — it is the same single room, every time.
This is the part the city omits to fit their narrative. The city has been getting a raise on this tax every single year for four decades without ever having to ask for one. It did not need an election, because the tax was written as a percentage. Now it wants a bigger percentage of a much larger number, and it is calling that its first increase since 1983.
What the “unchanged” hotel tax actually collected
Burbank hotel tax revenue by fiscal year. The rate was ten percent in every one of these years.
A raise every year, for doing nothing different
“We have not adjusted the hotel tax since 1983” is a sentence built to sound like restraint. Read it again. What has not changed is the formula. What the city collects has changed every single year, in the city’s favour, automatically, without anyone voting on it.
Think about what actually moves a room rate. The hotel’s insurance premium goes up — if it can still get insurance in California at all. Its electricity bill goes up; Burbank itself is raising that 9.9% in January. Housekeeping wages go up. So do linens, mattresses, breakfast, the water bill, the roof, the payroll taxes and the mortgage. Every one of those is a cost the hotel has to absorb and eventually price into the room.
And the moment it does, the city’s cut goes up with it. Not because the city hired another inspector, paved another street, or answered another call. The room got more expensive, so ten percent of it got bigger. That is the entire mechanism.
Inflation is a raise for the city. A wage increase is a raise for the city. A rise in the cost of electricity — a cost the city itself sets — is a raise for the city.
The hotel takes the risk. It carries the payroll, signs the loan, absorbs the bad months, and answers for every cost increase that lands on it. The city takes ten percent of whatever comes out the other end, in good years and bad, and describes itself as a partner in the enterprise.
It is not a partner. A partner contributes something. This is a commission — collected by an entity that puts in no capital, carries no risk, and does no work — and it has been quietly growing for forty-three years. Now the city would like the commission raised from ten percent to twelve.
It cuts both ways, and it did. When the hotels emptied out in 2020 the city’s take collapsed with them, from $11.1 million to $5.5 million. But notice what did not happen. The city did not come to the voters during the actual emergency, when it genuinely had a hole. It waited until hotel revenue had fully recovered and reached an all-time high — and then asked for more.
For its first fifty-three years, this city had no hotel tax at all
Burbank was incorporated in 1911. For the first fifty-three years of this city’s existence there was no hotel tax of any kind. Not a penny.
Then the city created one, at four percent. Then the city raised it to five. Then the city raised it to ten. Now the city would like twelve.
The number has only ever moved in one direction, and the direction is not down.
| Burbank’s hotel tax | Rate |
|---|---|
| Before July 1964 | no hotel tax at all |
| July 14, 1964 — the tax is created | 4% |
| November 7, 1967 | 5% |
| September 27, 1983 | 10% |
| December 2022 — council lifts the code ceiling to 12% | 10% |
| November 2024 — council puts the ceiling back | 10% |
| November 2026 — Measure C | 12% |
And look closely at what the city calls its last “adjustment.” In 1983 the rate went from five percent to ten. They doubled it. That is the event now being held up as evidence of four decades of restraint.
This is what it looks like from the other side of the counter. A business opens in Burbank. Over time the city discovers a percentage it can take, then a larger percentage, then a percentage of something else. The hotel tax, the utility users tax, the in-lieu transfer on the power bill, the business registration, the zoning review, the annual business tax, the permit to work from your own spare bedroom. Every one of them arrived as a small, reasonable-sounding number. None of them has ever gone away, and the only direction any of them has ever moved is up.
One more thing about that 1983 date. In December 2022 the City Council raised the ceiling in the municipal code from 10% to 12% by ordinance — no election needed, because lifting a cap is not the same as levying the tax. In November 2024 it put the cap back down to 10%. Two years later it is asking you for the same two points at the ballot box.
We think ten percent is already way too much
Burbank gives away so much free stuff, and this is who they expect to pay for it.
Set aside the history for a second and just look at the number. On an average $190 room, Burbank already takes $19 a night before the hotel has paid a single employee. Measure C makes it $22.80. There is no principle anywhere that says the correct figure is twelve rather than ten — there is only a budget gap and a search for someone to hand the bill to.
And Burbank residents are not standing on the sidelines of this. They already fund the same General Fund through property taxes, sales taxes, business taxes, and a long list of city fees. In the very same window Measure C would take effect, the city has already adopted:
| Already adopted for Burbank households | Increase | Typical monthly cost |
|---|---|---|
| Electric rates, January 2027 | +9.9% | +$23.76 |
| Water rates, January 2027 | +14% | +$12.49 |
| Refuse, FY 2026–27 | +8% | +$3.38 |
| Sewer, FY 2026–27 | +6% | +$1.80 |
| Before Measure C adds a cent | +$41.43 |
A household in this city is already absorbing about $41 a month in new utility costs this year. Measure C is not the first ask. It is the fourth.
They are already taxing your power bill for the General Fund
Here is the part almost nobody notices, because it is printed in small type on a bill most people never read past the total. Look at any Burbank electric bill and you will find two separate line items that have nothing to do with electricity. Neither one buys a single kilowatt-hour. Both go to the same General Fund that Measure C would feed.
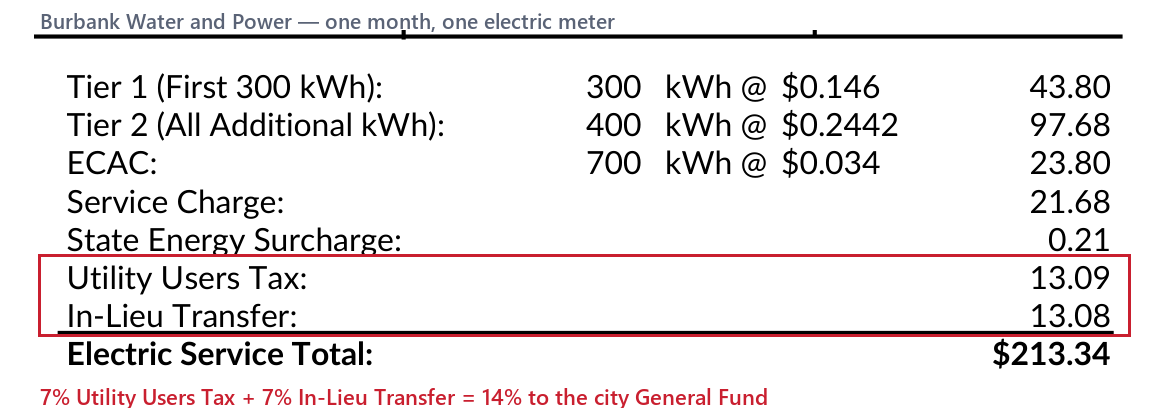
One month, one meter, from a Burbank Water and Power bill dated August 2026. Click to enlarge.
The Utility Users Tax is exactly what it sounds like: a straight 7 percent tax on your electricity, collected by the utility and handed to the city. The In-Lieu Transfer is another 7 percent, and it exists because Burbank Water and Power is owned by the city. A private utility would pay property taxes and franchise fees; a city-owned one does not, so it transfers the money to the General Fund “in lieu” of those taxes instead. The effect on your bill is identical to a tax, because it is one.
Fourteen percent. Every Burbank electric bill carries a 7% Utility Users Tax plus a 7% In-Lieu Transfer, added on top of what the power actually costs. On the real bill above, $186.96 of electricity carried $26.17 in city charges.
And it is the same trick as the hotel tax. Both are percentages. Nobody has to vote to raise them — they go up on their own every time a rate goes up. When electric rates rise 9.9% and water rises 14% in January 2027, the city’s cut of your utility bill rises right along with them, automatically, without a ballot measure.
Now the scale. The in-lieu transfer alone moves $11,753,000 out of Burbank Water and Power ratepayers and into the General Fund in FY 2026–27 — nearly four times everything Measure C would raise. The Utility Users Tax raises another $22,425,000 across electricity, gas and telephone service.
| Already coming off utility bills, FY 2026–27 | To the General Fund |
|---|---|
| In-lieu transfer — 7% of retail electric sales | $11,753,000 |
| Utility Users Tax — 7% on electricity, gas and telephone | $22,425,000 |
| Automatic rise in the in-lieu transfer from the January electric increase, no vote required | +$1,058,667 |
| Everything Measure C would raise in a year | $3,000,000 |
The automatic increase alone — the part nobody gets to vote on — is worth about a third of Measure C by itself.
And calling it a tax is not our characterisation. It is the city’s own. Section 610A of the Burbank City Charter, added by Measure T in June 2018, states in its own text that the transfer “was always funded through retail electric rate payers,” authorises Burbank Water and Power to recover it “in retail electric rates or as a surcharge to retail electric rates,” and recites that in Spencer v. City of Burbank the trial court found the transfer portion of the electric rate is a tax under Proposition 26.
So when the flyer says Measure C “does not increase taxes on Burbank residents,” understand what it is leaving out: the city already collects roughly $34 million a year in taxes and transfers off household utility bills, a court has already held that part of it is a tax, it is scheduled to take about a million dollars more in January, and none of that required your permission.
They even charge you to work from your own house
If you run a business out of your home in Burbank — a consultant, a bookkeeper, an editor, anyone with a laptop and a spare bedroom — the city requires a Home Occupation Permit, and it charges you for it. No customers visit. No sign goes up. No city service is consumed that was not already being paid for through property tax. The permit exists because working from your own house is treated as something the city is entitled to be paid for.
From our earlier reporting
“Consider a Burbank mother who wants to teach piano to children in her own living room. First she must apply for a Home Occupation permit. Burbank’s fee schedule, which the City Council voted to approve, charges $1,488.83 for that permit. The City names her business in the line item itself: ‘Home Occupation (including Music Lessons).’ At forty dollars a lesson, she has to teach thirty-seven lessons before she has paid for the permit. Some people look at that number and never apply at all. That is a small business that never opens.”
Burbank Republican Party, An open letter on council independence
That fee has since gone up again, with the same annual escalator that raises it every July.
| To work from your own spare bedroom in Burbank | Cost |
|---|---|
| Business registration | $51.29 |
| Zoning review | $77.52 |
| Minimum annual business tax | $130.70 |
| First year, before you have earned a dollar | $259.51 |
Then $130.70 every year after that, plus a charge for each employee — and the whole schedule escalates automatically every year with an inflation index. Another rate nobody votes on.
That is the pattern worth holding onto as you read the rest of this. This is not a city that has run out of ways to raise money. It is a city that has run out of restraint about using them.
The City falsely claims “it does not increase taxes on Burbank residents”
That sentence is on the city’s own flyer, in bold, three times. Here is the flyer — click to read the whole thing.
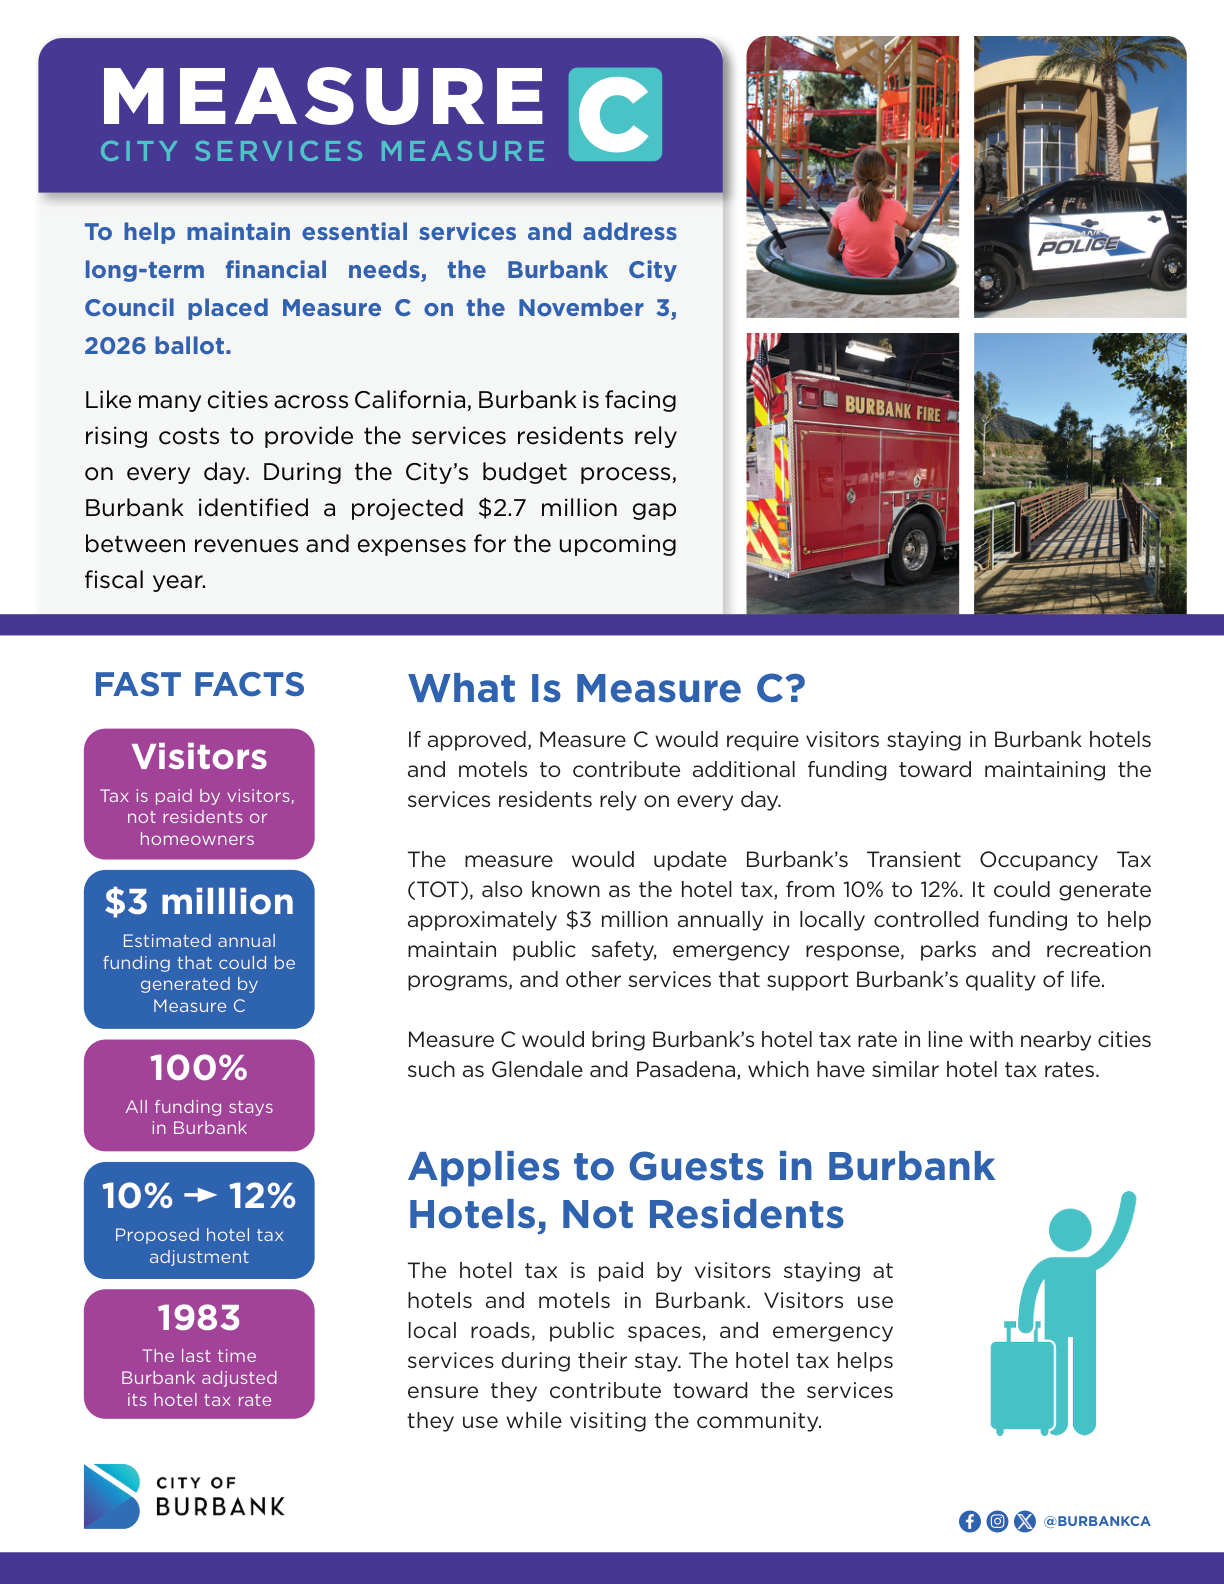
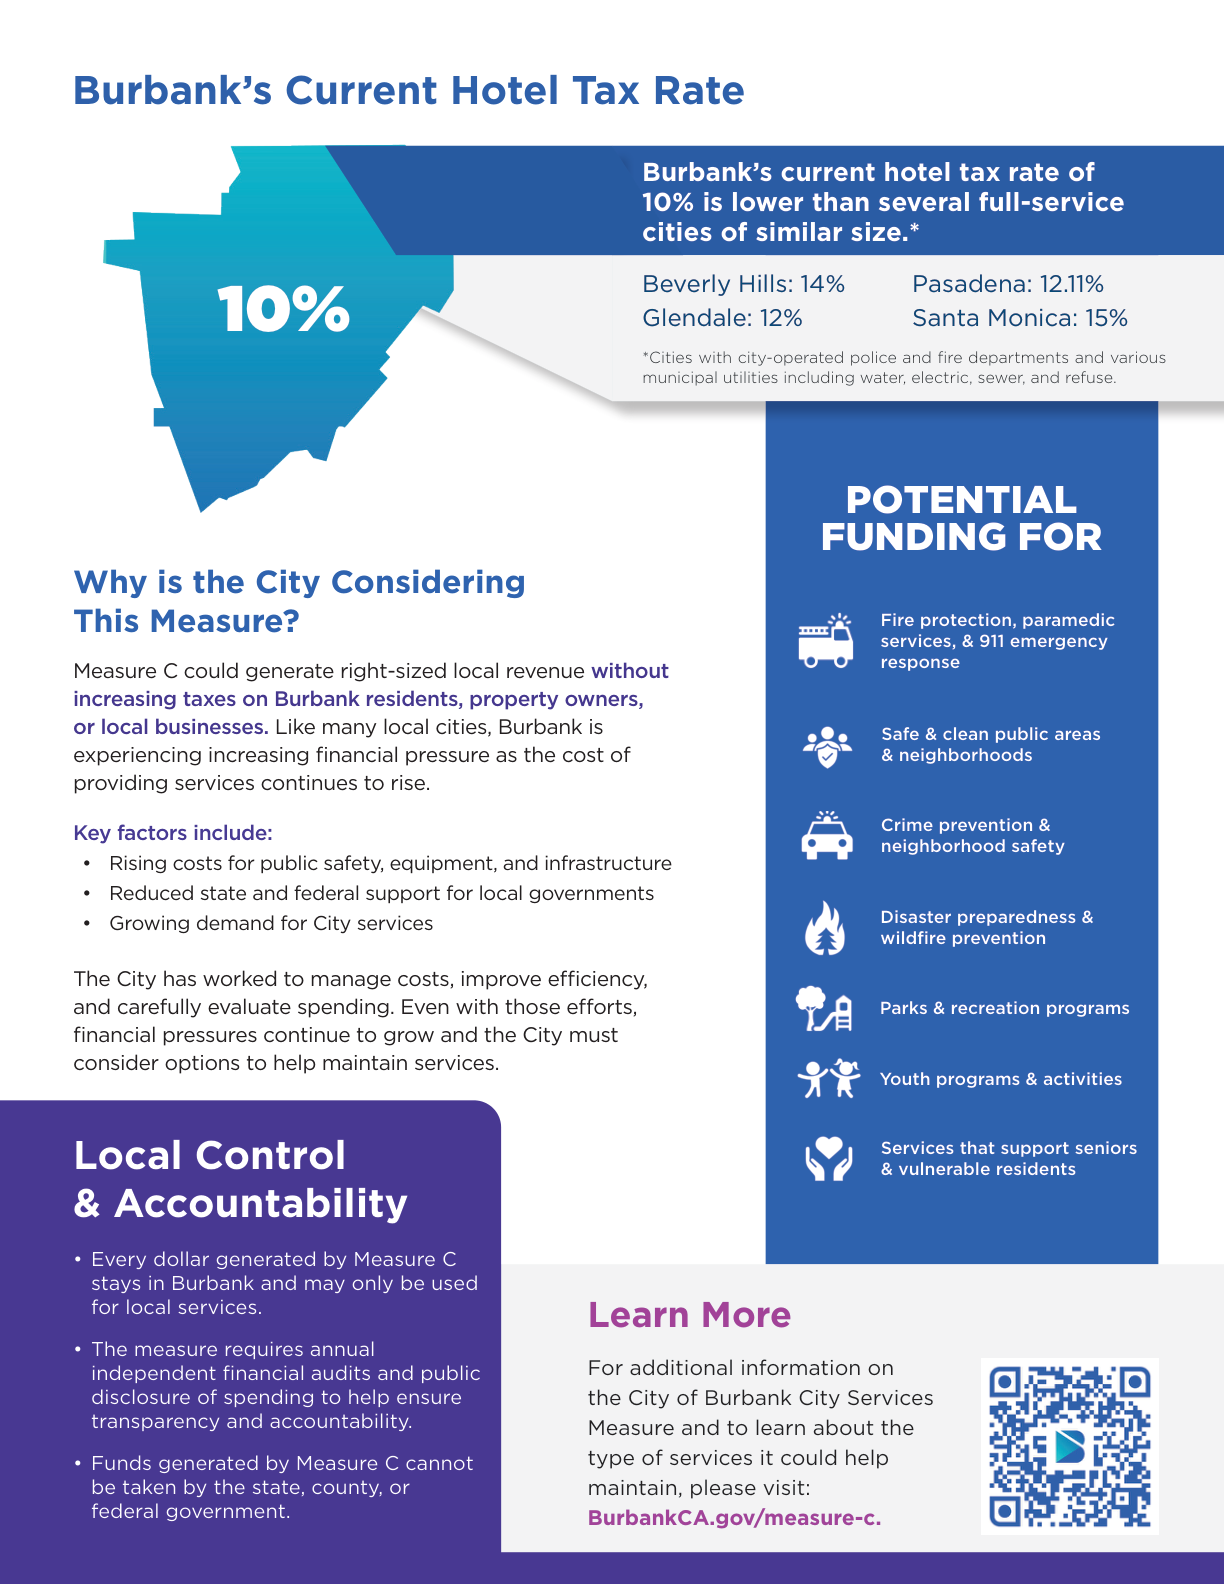
The City of Burbank’s official Measure C fact sheet, published at burbankca.gov. Click either page to enlarge. Note the four numbers the city chose to lead with — and notice which ones are missing.
Tell “it does not affect residents” to the family whose kitchen remodel puts them in a hotel for two weeks. Tell it to the homeowner displaced by a burst pipe or a fire. Tell it to the resident whose out-of-town parents come in every Christmas, or whose relatives fly in for a wedding, a graduation, or a funeral. Tell it to the hotel worker whose employer now has to explain to a corporate travel department why Burbank costs more than the identical room three miles away.
Anyone who ever needs a room in this town pays this tax. Calling it a visitor tax is a marketing decision, not a fact.
Read the fine print: this is a blank check
The city’s materials list public safety, emergency response, and parks. None of that is binding. The City Attorney’s own impartial analysis says the money goes into the General Fund to be used for general governmental purposes — which is precisely why it needs only a simple majority to pass rather than the two-thirds a dedicated tax would require. The services named in the ballot question are illustrative. They are not a promise, and no future council is bound by them.
It never expires. The ballot language says the increase runs “until ended by voters.” There is no sunset clause, no review date, and no trigger that turns it off when the deficit closes.
And the deficit does close. The city’s own five-year forecast projects the recurring General Fund gap shrinking from $2.647 million in FY 2026–27 to $1.363 million by FY 2030–31. By that same year the two extra points would be raising roughly $3.38 million — about two and a half times the gap it is being sold to close.
Where the money is actually going: overtime
This is the part that decides the question. Line mechanics keep the power on and firefighters run into buildings, and none of what follows is aimed at any individual for doing the job in front of him. But the compensation this city has agreed to has drifted a very long way from what the taxpayers funding it earn, and it did not drift there by accident. It is the product of contracts and staffing decisions made by management — and it is the reason the budget never balances.
The problem is a planning problem, and it sits with management. Burbank budgets one number for overtime and spends roughly double it, year after year, and has done so for at least four consecutive years.
| Fiscal year | Overtime budgeted | Overtime actually spent | Overrun |
|---|---|---|---|
| 2021–22 | $7,346,616 | $16,212,779 | $8,866,163 |
| 2022–23 | $8,953,175 | $19,295,279 | $10,342,104 |
| 2023–24 | $10,421,754 | $20,710,443 | $10,288,689 |
| 2024–25 | $12,048,556 | $26,095,001 | $14,046,445 |
| Four-year total | $43,543,401 |
In one year — FY 2024–25 alone — Burbank went $14.0 million over its overtime budget. That single overrun is 4.7 times everything Measure C would raise.
Independently, the California State Controller puts citywide overtime actually paid in calendar 2025 at $21,965,027, up 80 percent since 2020. The two figures cover slightly different periods and count slightly different premium pay, and both of them are more than seven times what Measure C raises.
By department in FY 2024–25: Burbank Water and Power $10.96 million, Fire $7.96 million, Police $6.26 million. And here is the tell — after spending $6.26 million on police overtime, the city turned around and budgeted $1.46 million for FY 2026–27. That is not a forecast. That is a placeholder, and everyone involved knows it will be blown through.
There is a better way. When a city routinely pays time-and-a-half to cover work it knew was coming, the honest fix is to budget the real number and staff to the real workload. Overtime at this scale is the most expensive possible way to buy labor, and a line mechanic booking $190,000 in overtime is not living a comfortable life — he is living at work. Fix the staffing plan and the number comes down without anyone being harmed. Raising the hotel tax fixes nothing; it just pays the bill for another year without anyone at City Hall having to ask why the bill looks like this.
One caveat, because it is a real one: part of the FY 2024–25 Fire increase is mutual-aid strike teams sent to the January 2025 Palisades and Eaton fires, and the state reimburses some of that. The city does not break out how much. But the pattern of budgeting half of what gets spent runs back four years and predates those fires entirely.
What Burbank actually pays its people
These come straight from the city’s own payroll records, which the Burbank Republican Party obtained from the City of Burbank under the California Public Records Act. What rolls past below is total cost of employment — salary, overtime, and every employer-paid pension and health contribution the taxpayer funds. There is no base salary here. Base salary is the number that makes this look reasonable, and it is not what any of it costs you.
Burbank total compensation, live from the payroll file
Fiscal year 2025 · 1,858 employee records · obtained by public records request
Source: City of Burbank payroll records, obtained by the Burbank Republican Party under the California Public Records Act. Total cost of employment, fiscal year 2025. Hover to pause.
A line mechanic supervisor at Burbank Water and Power costs the city $585,459 a year — more than the general manager who runs the entire utility ($501,841), more than the fire chief ($522,614), and more than the city attorney. Twelve people who are not managers, not chiefs and not directors are paid more than the person who runs the city.
Across the whole payroll: 539 city employees cost more than $200,000 a year, 222 cost more than $300,000, 61 cost more than $400,000, and nine cost more than half a million dollars. In calendar 2025, forty-two employees were paid over $100,000 in overtime alone; one was paid over $200,000 in overtime alone.
We ran these same payroll records earlier this year, in our open letter to the City Council on council independence. What we found then bears repeating here, because it is the clearest measure of how far this has drifted:
From our open letter on council independence
“Across the whole payroll, City compensation repeatedly outran the salaries attached to some of the highest offices in public life. 510 City employees were paid more than a United States senator. 266 were paid more than the Governor of California. 34 were paid more than the President of the United States. No budget document explains why.”
Burbank Republican Party, An open letter on council independence — same payroll file, fiscal year 2025.
Thirty-four people in one city of 106,000 cost more than the President of the United States, whose salary has been fixed at $400,000 by statute since 2001. Five hundred and ten cost more than a United States senator. And the city’s response to that is to ask the hotels for another two percent.
None of that is the fault of the people collecting it. All of it is the result of decisions made by the people asking you to approve Measure C.
The empty buses
BurbankBus is the clearest illustration of the problem — and the city’s own budget book shows a bigger number than the federal transit database does, because the city’s figure includes the full cost of running the program: drivers, contractor payments, Metrolink station upkeep, and this fund’s share of regional transportation dues. That fuller number is the honest one, so that is the one used here.
| BurbankBus, FY 2024–25 actual | Figure |
|---|---|
| Total cost to run BurbankBus (Fixed-Route + Senior & Disabled Transit, per the city’s own budget) | $6,062,595 |
| Boardings (federal transit data, same period) | 211,543 |
| Fares collected from riders | $122,107 |
| Share of the cost covered by riders | 2.0% |
| Taxpayer subsidy, per boarding | $28.09 |
| Cost per senior and disabled ride (that program alone: $2,913,857 for 30,502 rides) | $95.53 |
| Net cost to taxpayers after fares | $5,940,488 |
The entire net cost of BurbankBus — nearly $6 million a year — is double everything Measure C would raise. Riders cover about two cents of every dollar.
And service is shrinking while the cost per rider climbs. Fixed-route service hours fell 18 percent between 2019 and 2024, revenue miles fell nearly 24 percent, the Green Route connecting North Hollywood to the Media District was eliminated, and ridership is still below where it was in 2019.
Nobody is proposing to strand the seniors and disabled riders who depend on the demand-response service. But a system where it costs the city $95.53 to deliver a single ride should be redesigned — contracted differently, right-sized, or run with the county — before anyone is asked for a tax increase that would not even cover half of what this one program costs.
To see just how far out of line that is, we priced a real ride on a real rideshare app, at the exact time we were writing this, covering nearly the entire length of Burbank — from Stough Canyon in the hills at the city’s northern edge to the Warner Bros. main gate at its southern border.
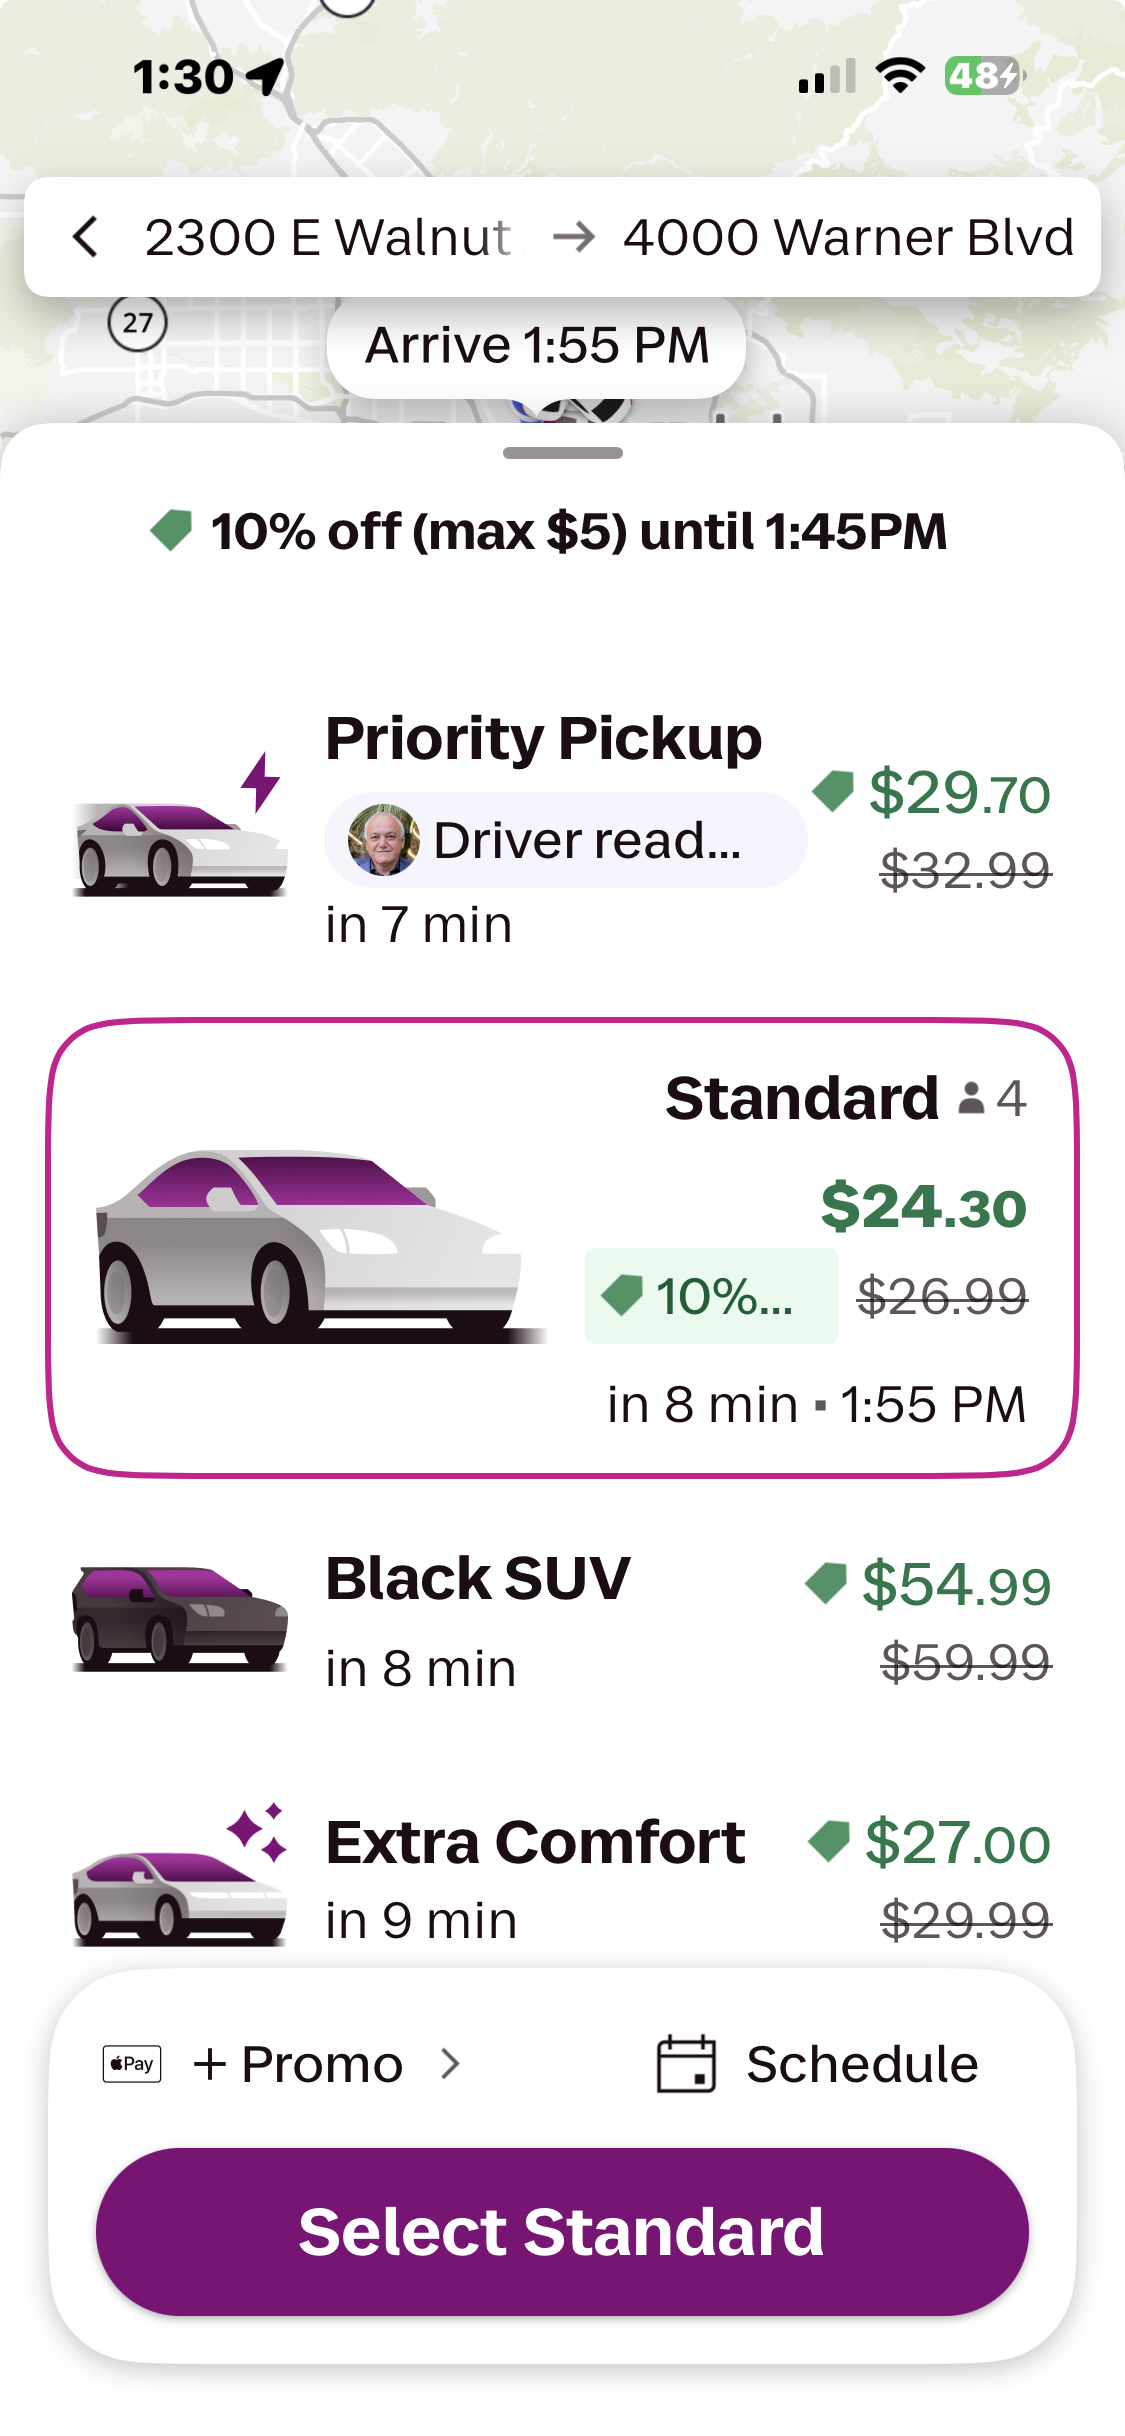
A real fare quote, priced live, for a trip spanning nearly the full length of the city — north edge to south edge. Click to enlarge.
$24.30. A private citizen can hire a personal ride across the entire city, door to door, for less than what it costs the taxpayer to move one senior a few miles across town on BurbankBus. And that $24.30 fare covers a trip far longer than almost anyone actually needs — most rides in this city are a fraction of that distance, which means most rides would cost even less. The city is paying nearly four times the price of a cross-town personal car service to deliver a ride that, for most riders, only has to go a few neighborhoods over.
The one they cancelled
A million dollars of consultants, and a building that will never exist
The Homeless Solutions Center was going to be built at 323 Front Street. The council cancelled it outright on April 7, 2026, once the cost had nearly doubled past the money available and the annual operating bill had no funding source at all.
By then about a million dollars was already gone — spent on design work, consultants and environmental studies for a building that will never be built. Roughly $750,000 of that is state money the city may have to pay back.
That is a third of everything Measure C would raise in a year, spent on nothing at all. Not overspent. Not spent badly. Spent on a thing that does not exist and never will.
Meanwhile, the General Fund line for homeless programs and services is going from $507,091 to $1,051,154 — it doubles — in a year when the Point-In-Time count of people experiencing homelessness in Burbank fell, from 219 to 197. The count went down. The spending doubled. Nobody at City Hall has been asked to explain why.
One more thing worth knowing, and it comes from the city’s own adopted homelessness plan: asked whether it tracks where the people it serves lived before they became homeless, the city answered that the data “does not track a person’s community of origin.” Burbank is spending millions of dollars a year on a program and does not know who it is serving.
Why is the taxpayer in this transaction at all?
The city’s FY 2026–27 budget carries a $500,000 “Enhanced Renters Relocation Program,” plus a related $330,000 pilot. In plain terms: when a housing provider ends a tenancy, the city now pays the tenant’s moving costs.
This is a lease. It is a private agreement between two parties, and California law already governs how it ends — a housing provider who ends a lease without cause owes the tenant a month’s rent under state law. That is a transaction between the two people who signed it. It is not a public expense, and it is not the City of Burbank’s business.
We checked how ten other cities across Los Angeles County handle it.
| City | Who pays relocation costs |
|---|---|
| Culver City | Housing provider — up to 3 months’ rent plus $1,000 |
| Inglewood | Housing provider — up to 3 months’ rent plus as much as $7,500 more |
| Alhambra | Housing provider — 3 months’ rent |
| Redondo Beach | Housing provider — 2–3 months’ rent |
| Monrovia | Housing provider (mobile-home parks only) |
| Arcadia | Housing provider (condo conversions only) |
| Torrance | Developer (condo conversions only) |
| Glendora | Housing provider, state minimum only — no local add-on |
| Whittier | Housing provider, with the city advancing payment and then billing the housing provider back |
| Long Beach | Housing provider, with the city advancing payment and placing a 12% lien against the property |
| Burbank | The taxpayer. No housing provider repayment. No lien. |
In every one of the ten, the cost sits between the two parties to the lease. Even the two cities where the city advances the money bill it straight back, with interest. Only Burbank simply pays it and walks away.
We are not arguing that Burbank should copy Whittier’s lien or Long Beach’s 12% interest rate. We do not think the city has any business inserting itself into a private lease at all — not as the payer, and not as the collector either. What a housing provider and a tenant owe each other when a tenancy ends is between them and the courts. It was never the taxpayer’s obligation, and it should not become one now because the City of Burbank decided to write a check.
Nobody voted to make Burbank a party to other people’s leases. The city simply appropriated itself into the transaction and sent the bill to the General Fund — the same General Fund Measure C is supposed to rescue.
And every year there is more to pay for
Here is the other half of the equation. While the take from business has climbed, the list of things the city hands out has climbed with it. Look at the city’s own schedule of one-time General Fund items for this year alone.
| A sample of this year’s one-time General Fund items | Cost |
|---|---|
| Homeless services contract, to sustain current service levels | $644,063 |
| Enhanced renters relocation program | $500,000 |
| Senior nutrition | $312,500 |
| Motel vouchers and a housing crisis program | $285,000 |
| Recycling receptacles | $235,000 |
| Fourth of July drone show contract | $250,000 |
| Performing arts | $100,000 |
| Job Connect Plus | $90,000 |
| Sister city funding | $25,000 |
| Utility box beautification | $8,750 |
| Total one-time General Fund items, FY 2026–27 | $3,952,658 |
In our opinion, could be handled by nonprofits or churches at a much lower cost than the city currently pays.
In our opinion, could be covered by corporate sponsorship — a local company or a national brand — instead of taxpayers.
To be clear about where we stand: we care about seniors, we care about people who have fallen on hard times, we support the performing arts, and we believe in recycling. None of that is in question. What is in question is whether a city government is the right vehicle to deliver it.
We do not think it is. A city has to fund every one of these programs through employees on public payrolls, under union contracts, earning pensions the taxpayer guarantees for the rest of their lives — the same structural costs driving the overtime and compensation numbers elsewhere on this page. Churches and nonprofits deliver the same help without any of that overhead, and they answer directly to the donors and neighbors who support them, not to a budget line that only grows. Government in Burbank is doing far more than government should be doing, at a far higher cost than it should take.
Take the performing arts line in the table above. The Musicians Club of Los Angeles, headquartered right here in Burbank, holds $16.2 million in assets. An organization built for exactly this purpose, sitting on that kind of endowment, is the appropriate place to ask for a contribution toward the performing arts — not the General Fund, and not hotel guests. If the funding gap is real, that is who should be asked first.
Milton Friedman put it simply: “Nothing is so permanent as a temporary government program.” Every item in the table above started as a modest, well-intentioned add. None of them has ever gone away, and the bill for all of them together is now larger than the tax increase you are being asked to approve.
Some of this overlap is easy to miss because it is not even in the budget line items above — it is baked into ordinary city operations. The Burbank Public Library, for example, already lends free WiFi hotspots to any adult cardholder in good standing, no charge to borrow or use. It is a fine program — but it is also proof that closing a “digital divide” does not require a new tax or a new department. The library already does it, out of a book-lending budget, for free.
The money already exists
Local Burbank nonprofits hold $2.5 billion in assets
There is no reason taxpayers should be funding local philanthropy projects — many of which they may not even agree with — when the nonprofit sector sitting in this city already holds this much money. If the need is real, this is where it should be asked for.
302 organizations with reported figures, refreshed monthly. $1.4 billion in combined receipts. $2.5 billion in assets. Compiled by the Burbank Republican Party from public IRS filings.
The city’s list of one-time extras for this year comes to $3,952,658 — more than Measure C would raise in a year.
And that is only the part with a line item. Public Wi-Fi is free. Bus rides are free for Burbank middle and high school students. Showers, laundry, and secure storage are provided free. Library hotspots go out on loan. Recreation fees are subsidised for hundreds of households through the city’s PASS program. Fireworks became a drone show at $105,000 a year more than the fireworks cost.
Take any one of these and it is defensible. Some of them are genuinely worth doing. But that is exactly how this happens — nobody ever has to defend the whole list at once, because the whole list is never on one page. It is on this one. Every item on it is permanent in practice, none of them arrived with a revenue source attached, and the bill lands on the businesses and ratepayers who never got a vote on any of it.
That is what Measure C actually funds. Not fire trucks. The gap between what this city has decided to give away and what it is willing to stop doing.
The bill that is actually coming
Measure C raises $3 million. Here is what is bearing down on the General Fund at the same time.
| The real pressure on Burbank’s budget | Amount |
|---|---|
| Share of the General Fund that is salaries and benefits | 72% |
| CalPERS pension contribution, FY 2026–27 | $40,568,575 |
| Projected CalPERS contribution, FY 2028–29 | $49,007,000 |
| Annual increase in the pension bill by FY 2028–29 | +$8,438,425 |
| Unfunded pension liability across all three plans | ~$435,000,000 |
| Everything Measure C raises in a year | $3,000,000 |
The pension increase alone is nearly three times Measure C. If the two extra points were dedicated entirely to pensions — which they are not, because this is a general tax — they would cover about a third of the growth, and the gap would be back within two years. This measure does not solve the problem. It postpones the conversation.
And they are not short of money today
Burbank’s audited financial statements for the year ended June 30, 2025 show a total General Fund balance of $178.8 million, of which $127.1 million is unassigned — money carrying no designated purpose at all. That unassigned balance by itself is roughly half of everything the General Fund spends in a year. Formal reserves stand at $65.7 million, and the city projects them growing to $79.3 million by FY 2030–31.
A city holding $127 million in unassigned reserves is asking you to make a $3 million tax permanent, to close a gap its own forecast says shrinks to $1.4 million.
And in June they bought a $14.4 million building on the consent calendar
On June 2, 2026 — at the very same meeting where it adopted the budget containing the $2.6 million deficit Measure C is meant to close — the City Council approved the purchase of 110 West Olive Street for $14.4 million. The vote was four to nothing. It was on the consent calendar, the part of the agenda reserved for routine business passed in a single motion without debate. There was no discussion.
Four million dollars of the purchase price came straight out of General Fund unassigned fund balance. And the environmental finding filed alongside it states that the acquisition was “undertaken without plans for any specific use or development.” The city bought a $14.4 million building without having decided what it is for.
Four million dollars of General Fund money, in one unanimous motion, with no debate, on a property with no stated purpose — at the same meeting that adopted the deficit Measure C is supposed to fix.
If a household ran its finances this way — buying a building it had no plan for, then asking the neighbours to chip in for groceries — nobody would call it a revenue problem.
Things that could be looked at first
None of the following requires a single layoff, and all of it comes out of the city’s own budget book.
- Budget overtime honestly and staff to the real workload. A $14 million annual overrun is not a surprise after the fourth year in a row.
- Redesign or re-contract BurbankBus. $15.89 of subsidy per boarding, with a route already eliminated, is a system asking to be rethought.
- DeBell Golf Course pays for itself — it netted $664,016 in FY 2024–25 and has been in the black six of the last seven years — but the trend is going the wrong way. Operating costs rose from $3.68 million to $4.24 million in three years, up 15%, while revenue slipped from $5.03 million to $4.91 million and rounds played fell from 80,286 to 75,093.
- The Starlight Bowl has been closed since the January 2025 windstorm and its 2025 season was cancelled. The city has put $1.9 million into a transformation project whose own consultant forecasts a $2.6 million a year operating budget once it reopens.
- The consultant list. The budget carries 566 outside agreements, including dozens of separate on-call planning, transportation, and building-and-safety contracts at $500,000 to $2,000,000 each, and roughly sixty line items where the vendor has not even been selected yet.
- Fireworks became a drone show at $105,000 a year more, on a $250,000 contract.
- Headcount is up 37 positions in two years while the Police Department is down nine.
On parks, the number that matters is not the land, it is the payroll. Burbank has 1.38 acres of developed parkland per thousand residents against its own General Plan goal of 5.0, so there is no surplus park land here to sell. But the city’s own Parks Master Plan reports a staffing ratio of 18.12 parks employees per 10,000 residents against a national average of 7.9 — more than double. That is where the money went, and it is a management question, not a question of closing anybody’s neighbourhood park.
Same parks, same acres, triple the bill
Parks spending nearly tripled. The parks did not.
We love our parks, and we are not asking anyone to close one. But the honest comparison is not complicated: the same 26 parks, on the same 731.85 acres, serving a population that has not grown, now cost this city nearly three times what they cost twenty years ago. Nothing about the physical parks system explains that. The payroll and the management model explain it.
And a fair share of who is using them lives outside Burbank entirely. The city’s own 2025 pickleball court survey found 32% of players came from outside Burbank. One of the largest club users of the aquatics center, a competitive swim team, reports 30% of its roster is non-resident. Nobody is charged at the gate of a city park, and nobody tracks how many of the people walking through Burbank’s parks live in Glendale, North Hollywood or Los Angeles rather than here.
To be fair, some of that comes back — a family that spends the afternoon at a Burbank park may also stop for lunch or shop on the way home, and that spending shows up in the same sales tax base that funds the General Fund. But the city has never measured it, so nobody can say whether it covers any meaningful share of a $42 million budget. Burbank residents are certain to be paying for it. Whether the return comes back to Burbank is, at best, unproven.
The animal shelter doesn’t have to be the taxpayer’s job either
Burbank runs its animal shelter as a city department. The FY 2026–27 budget for it is $2,870,761, with 15.5 city staff positions, paid out of the same General Fund Measure C is meant to rescue.
Meanwhile, the volunteer nonprofit built specifically to support that shelter — Volunteers of Burbank Animal Shelter — is sitting on $1,674,469 in assets against just $399,340 in revenue this year. That is more than four times its annual income held in reserve, from an organization that exists for exactly this purpose, while the city carries the entire operating cost as a taxpayer department. If the shelter needs help, the organization built to provide it already has the money sitting in the bank.
And running the shelter as a city department is a choice, not a necessity. Plenty of California cities Burbank’s size don’t do it this way — they contract animal sheltering to a nonprofit instead of operating an in-house department, and it costs a fraction of what Burbank spends.
We went through every Southern California city we could find that hands animal control to a nonprofit instead of running it in-house. The list below keeps only the cities where a real dollar figure is actually published somewhere — a budget line, a council staff report, a signed contract — not a city that merely lists a provider’s name with no number attached. Every row here is a real, sourced cost, ranked highest to lowest, across every size of city from about 1,000 residents to nearly 150,000. The range itself is the point: this is not a model that only works for one kind of town, and Burbank still comes out on top.
| City (population) | Nonprofit provider | Annual cost |
|---|---|---|
| Burbank (106,000) | City department, in-house | $2,870,761 |
| Pasadena (138,000) | Pasadena Humane Society | ~$1,800,000 |
| Escondido (152,000) | San Diego Humane Society | ~$1,050,000–$1,390,000 |
| Baldwin Park (75,000, starting 2026) | Inland Valley Humane Society | $1,085,000 |
| El Cajon (106,000) | San Diego Humane Society | ~$1,000,000 |
| Carlsbad (115,000) | San Diego Humane Society | ~$941,000 |
| Chino Hills (78,000) | Inland Valley Humane Society | ~$829,000 |
| Arcadia (57,000) | Pasadena Humane Society | $525,000 |
| Diamond Bar (55,000) | Inland Valley Humane Society | ~$480,000 |
| Claremont (36,000) | Inland Valley Humane Society | $466,416 |
| Imperial Beach (28,000) | San Diego Humane Society (new, 2025) | ~$400,000 |
| Monrovia (37,000) | Pasadena Humane Society | ~$346,000 |
| La Mesa (60,000) | San Diego Humane Society | ~$325,000 |
| South Pasadena (26,000) | Pasadena Humane Society | ~$225,000 |
| Seal Beach (25,000) | Westminster Adoption Group and Services | $72,000–$163,000 |
| La Cañada Flintridge (20,000) | Pasadena Humane Society | $146,000 |
| Westminster (90,000) | Westminster Adoption Group and Services | $108,000 |
| La Verne (32,000) | Inland Valley Humane Society | ~$53,000 |
| Bradbury (1,000) | Pasadena Humane Society | $20,415 |
El Cajon has almost the exact same population as Burbank. It pays a nonprofit about $1 million a year for animal control. Burbank runs the same service as a city department for $2.87 million — nearly three times as much, for the identical number of residents.
These cities are not identical to Burbank, and we would rather show the real numbers than call them “similar” and hope nobody checks. According to the U.S. Census Bureau’s American Community Survey, Burbank’s median household income is $95,816. El Cajon — the closest population match on this list, at 106,000 residents to Burbank’s own 106,000 — is actually a lower median household income than Burbank, at $66,773. Pasadena, at $103,778, is close to Burbank’s figure. Carlsbad is the one city on the list with a median household income substantially higher than Burbank’s, at $139,326. On population, Bradbury (1,000) is legitimately far smaller and Escondido (152,000) is the largest, but most of the list sits within a normal range around Burbank’s own 106,000, not in a different league entirely. In every single case where we could verify a real number, the nonprofit model cost less — usually far less — than what Burbank pays to run the identical service as a city department with a 15.5-position payroll and a pension attached. Burbank’s $2,870,761 is the single largest number on this entire list.
None of these arrangements are free — each city still pays a real contract. But animal sheltering is, at its core, a philanthropic function. It is exactly the kind of work nonprofits exist to do, and city after city proves it can be done for a fraction of what it costs to run as a government department. Burbank has a shelter, a nonprofit built to support that very shelter already holding real money in reserve, and a whole menu of cities of every size proving the cheaper model works. It has chosen the most expensive path available anyway.
Twenty-three years and counting
The city has owned a vacant lot since 2003 — and called it surplus itself in 2021
This is 2.43 acres the city has owned for 23 years, sitting beside its own power plant and immediately next to the Downtown Burbank Metrolink station — about as valuable a location as this city has to offer. The building on it sat empty for 16 years before it finally burned down. And the city’s own staff identified this parcel by name as potential surplus land in November 2021. That was five years ago. Nothing has happened since.
This is not a hard problem the city hasn’t gotten to yet. The city government named the solution itself. It just never did it.
The last election Burbank held
72,003 people could vote. 40,182 of them didn’t. That is why your taxes keep going up.
That is not a typo. In Burbank’s most recent election, fewer than half of registered voters bothered to vote at all. A majority of the people this city taxes, licenses and fines simply did not weigh in. That is not an accident, and it is not a coincidence that the tax rate only ever moves in one direction. Every one of the increases documented on this page — the overtime, the pensions, the renters relocation program, the drone show, the $14.4 million building bought on the consent calendar — happened in exactly this kind of silence.
This is not about who you like or who you hate on the council, and it is not a Valentine to any candidate or party. It is self-preservation. A permanent tax on the room you rent when your relatives visit, a percentage taken off your own power bill, a fee to teach piano in your own living room — none of that stops because you didn’t pay attention. It only stops if enough people show up and vote no.
Burbank residents already pay 10.5% in combined sales tax on nearly everything they buy — and that includes a three-quarter-cent tax the city added on its own in 2018, on top of the county and state rates. It did not have to happen. A community survey found that eighty-four percent of respondents would eliminate Burbank’s local add-on entirely if given the chance. Nobody showed up in enough numbers to stop it, and now everyone pays it, every day, on every purchase. Measure C is the same story again, just at the hotel counter instead of the register.
This is decided by whoever shows up
Local measures are not won by argument. They are won by turnout. A tax that will be collected forever gets decided in an election most people do not think about, by a fraction of the people it affects.
And local races here are decided by a handful of votes. A Burbank council seat was decided by 379 votes in 2017, 419 in 2020, 512 in 2022 — when a sitting council member lost her seat — and 720 in 2024. Measure C needs a simple majority of whoever bothers to return a ballot. That is the whole bar.
Vote. Then make sure three other people in your household or on your street do too. Check your registration, watch for your mail ballot, and return it early — a ballot sitting on the kitchen counter on election day counts exactly the same as a vote for the tax.
Check the letter before you mark it. There are three city measures on this ballot. The one you are voting no on is C.
Why you must vote no on C
Because the tax has gone up every year for forty-three years and they are calling it the first increase since 1983. Because ten percent of a $250 room was already a generous cut. Because it is a general tax with no sunset and no binding promise about where the money goes. Because the deficit it is meant to close shrinks by more than half on the city’s own forecast while the tax runs forever. Because the city went $43.5 million over its own overtime budget in four years, spent a million dollars designing a building it then cancelled, and subsidizes a bus system at nearly sixteen dollars a rider — all while holding $102 million in reserves.
None of that is a revenue problem. Handing City Hall another three million dollars a year, permanently, with no strings attached, does not fix any of it. It just removes the last reason anyone downtown had to look at the numbers on this page.
Burbank Republican Party
Post Office Box 10631
Burbank, California 91510
burbank.gop
Research like this costs real time and real money to produce.
Click here to donate and support our mission →Sources
- City of Burbank, FY 2026–27 Proposed Budget (adopted by Council June 2, 2026; also posted at burbankca.gov) — overtime line items 60006 and 60007 by cost center; General Fund summary; reserves; staffing; contracts list; DeBell; homeless programs.
- City of Burbank adopted budgets, FY 2022–23 through FY 2025–26, for prior-year overtime actuals.
- City Attorney’s Impartial Analysis of Measure C. burbankca.gov
- Staff Report, placement of a general tax measure on the ballot, City Council, June 16, 2026. granicus.com
- City of Burbank Measure C fact sheet. burbankca.gov
- City of Burbank payroll records, fiscal year 2025, obtained by the Burbank Republican Party under the California Public Records Act.
- Burbank Water and Power residential statement, bill date August 19, 2026, provided to the Burbank Republican Party. Account number, customer name, service address and meter number were cropped from the image before publication and are not retained on this page.
- California State Controller, Government Compensation in California, City of Burbank. publicpay.ca.gov
- Rideshare fare comparison: live fare quote captured August 23, 2026, 1:30 PM, for a trip from Stough Canyon Nature Center (2300 E. Walnut Ave, Burbank) to the Warner Bros. Studios main gate (4000 Warner Blvd, Burbank).
- BurbankBus cost figures: City of Burbank FY 2026–27 Proposed Budget, Proposition A Transportation Fund and Proposition C Transportation Fund cost centers (Community Development Department, Transportation Division), FY 2024–25 actual. Boardings and fares: National Transit Database, agency 90256 (City of Burbank), report year 2024. data.transportation.gov. Federal funding confirmed at zero via NTD Funding Sources (Federal), 2022–2024. data.transportation.gov
- Staff Report, Homeless Solutions Center, City Council, April 7, 2026. granicus.com
- City of Burbank Five-Year Homelessness Plan, Attachment 1. burbankca.gov
- Los Angeles Homeless Services Authority, local jurisdiction count files, 2025 and 2026. lahsa.org
- City of Burbank Annual Comprehensive Financial Report, fiscal year ended June 30, 2025. burbankca.gov
- Los Angeles County Registrar-Recorder/County Clerk, certified list of measures for the November 3, 2026 consolidated general election, dated August 20, 2026. lavote.gov
- California Secretary of State, Report of Registration, May 18, 2026. sos.ca.gov
- Date of incorporation, July 8, 1911: California Association of Local Agency Formation Commissions, California Cities by Incorporation Date.
- Burbank Municipal Code ordinance list: Ordinance 1930 (July 14, 1964) creating the transient occupancy tax at 4 percent; Ordinance 2083 (November 7, 1967) raising it to 5 percent; Resolution 20,732 (September 27, 1983) setting it at 10 percent; Ordinance 22-3,984 (December 6, 2022) and Ordinance 24-4,018 (November 26, 2024) raising and then lowering the code ceiling. codepublishing.com
- Hotel tax revenue by fiscal year from the statistical section of the city’s Annual Comprehensive Financial Reports. Burbank average nightly room rate from the Visit Burbank annual reports, which publish an STR-sourced figure each year from FY 2012–13.
- Relocation assistance ordinances: Culver City Municipal Code § 15.09.325; Inglewood Municipal Code § 8-123; Alhambra Ordinance No. O2M26-4861 (AMC ch. 6.29); Redondo Beach Municipal Code § 10-2.1610; Monrovia Municipal Code ch. 15.40; Arcadia Municipal Code § 9105.23.040(H); Torrance Municipal Code § 91.36.8; Glendora Municipal Code ch. 5.36; Whittier Municipal Code ch. 9.52; Long Beach Municipal Code ch. 8.99 and ch. 18.25. California Civil Code § 1946.2(d) (statewide housing-provider-paid relocation minimum).
- City of Burbank Parks and Recreation Master Plan (2024), pp. 43–44, 50, 105; 2013 General Plan Open Space Element, Table OSC-2; Parks & Recreation operating budgets, FY 2003–04 and FY 2026–27; U.S. Census / California Department of Finance population estimates for Burbank. Pickleball Program Update, Parks and Recreation Board, November 13, 2025 (non-resident player survey). Aquatics annual report, BLAST swim team roster composition.
- City of Burbank FY 2026–27 Proposed Budget, Animal Shelter cost center 001.PR47A. Volunteers of Burbank Animal Shelter financial figures from the IRS Exempt Organizations Business Master File.
- Animal control contract figures compiled from each city’s own government website, adopted budget, council agenda packet, or contemporaneous local news coverage of the council action approving the agreement, including: Pasadena Now and Pasadena Humane Society’s own published service pages (Pasadena, Arcadia, Monrovia, South Pasadena, La Cañada Flintridge, Bradbury); Times of San Diego and San Diego Humane Society service records (El Cajon, Escondido, Carlsbad, Imperial Beach, La Mesa); PublicCEO (Baldwin Park, Inland Valley Humane Society service-area transitions); Champion Newspapers (Chino Hills); the City of Diamond Bar; the City of Claremont council agenda packet (March 25, 2025); the City of La Verne; and Sun Newspapers and the City of Seal Beach (Westminster Adoption Group and Services). City population figures from U.S. Census / California Department of Finance estimates. Median household income figures (Burbank $95,816; El Cajon $66,773; Pasadena $103,778; Carlsbad $139,326) from the U.S. Census Bureau American Community Survey, 2023 estimates.
- Former Americold site, 10 West Magnolia Boulevard: acquisition and vacancy history from City of Burbank Council staff reports, September 13, 2016 and November 2, 2021 (Surplus Property Protocol). granicus.com
- Burbank City Charter sections 610 and 610A. Section 610A was added by Measure T, approved by Burbank voters on June 5, 2018.
- Burbank Municipal Code sections 2-4-1102, 2-4-1103 and 2-4-1104 (Utility Users Tax), and the City of Burbank adopted schedule of fees and charges effective July 1, 2026.
- Budget at a Glance, FY 2026–27, for adopted utility rate increases. burbankca.gov
- Burbank Public Library, WiFi Hotspots program page. burbanklibrary.org